Pembina Pipeline Corporation

NYSE

Market Cap.

21.06B

Avg. Volume

1.32M

Price

1W %

1M %

3M %

6M %

1Y %

YTD %

--

--

--

--

--

--

--

AI Generated Qualitative Analysis

AI

Your time is precious, so save it. Use AI to get the most important information from the business.

Learn about Pembina Pipeline Corporation

Pembina Pipeline Corporation News

Pembina Pipeline Corporation Quantitative Score
Overall Score

Business

Growth

Unlock

Business

Quality

Unlock

Stock

Value

Unlock

Price

Move

Price

Momentum

Unlock

Price

Stability

Unlock
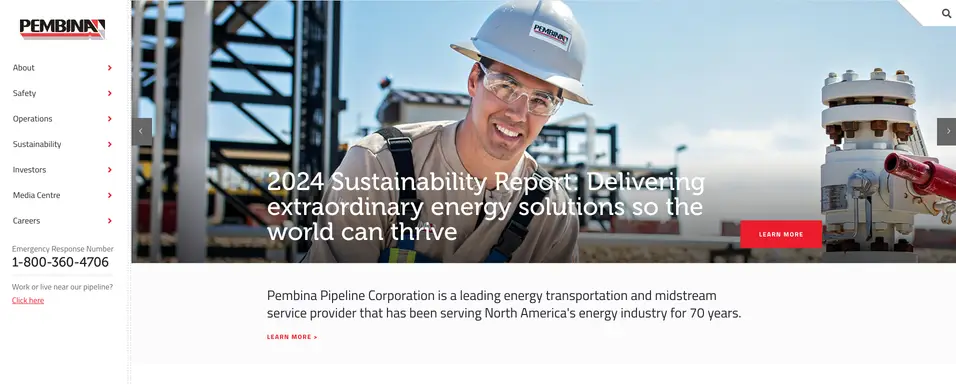
Website screenshot
EnergyOil & Gas Midstream
pembina.com

About Pembina Pipeline Corporation

Pembina Pipeline Corporation provides transportation and midstream services for the energy industry. It operates through three segments: Pipelines, Facilities, and Marketing & New Ventures. The Pipelines segment operates conventional, oil sands and heavy oil, and transmission assets with a transportation capacity of 3.1 millions of barrels of oil equivalent per day, ground storage of 11 millions of barrels, and rail terminalling capacity of approximately 105 thousands of barrels of oil equivalent per day serving markets and basins across North America. The Facilities segment offers infrastructure that provides customers with natural gas, condensate, and natural gas liquids (NGLs), including ethane, propane, butane, and condensate; and includes 354 thousands of barrels per day of NGL fractionation capacity, 21 millions of barrels of cavern storage capacity, and associated pipeline and rail terminalling facilities. The Marketing & New Ventures segment buys and sells hydrocarbon liquids and natural gas originating in the Western Canadian sedimentary basin and other basins. Pembina Pipeline Corporation was incorporated in 1954 and is headquartered in Calgary, Canada.

Pembina Pipeline Corporation Earnings & Revenue

What’s This Company Really Worth? Find Out Instantly.

Warren Buffett’s go-to valuation method is Discounted Cash Flow (DCF). Our tool makes it effortless — no spreadsheets, just answers in a few clicks.

Pembina Pipeline Corporation Financials

Table Compare

Compare PBA metrics with:


Earnings & Growth

PBA

None

EPS (TTM) YoY Growth

--

--

Revenue (TTM) YoY Growth

--

--


Valuation (TTM)

PBA

None

Price/Earnings Ratio

--

--

Price/Sales Ratio

--

--


Profitability & Efficiency (TTM)

PBA

None

Net Profit Margin

--

--

Return on Equity

--

--


Financial Health (TTM)

PBA

None

Debt/Assets Ratio

--

--

Assets/Liabilities Ratio

--

--


Pembina Pipeline Corporation Income

Pembina Pipeline Corporation Balance Sheet

Pembina Pipeline Corporation Cash Flow

Pembina Pipeline Corporation Financials Over Time

Analysts Rating

Strong Buy

Buy

Hold

Sell

Strong Sell

Metrics Scores

MetricsScore
Discounted Cash FlowsStrong Buy
Return on EquityBuy
Return on AssetsBuy
Debt/Equity RatioStrong Sell
Price/Earnings RatioSell
Price/Book RatioSell

Price Targets


Disclaimer: This 3rd party analysis information is for reference only and does not constitute investment advice.

Pembina Pipeline Corporation Dividends

Yield (TTM)Dividend (TTM) 

Infinity%

1.9882

Payment DateDividendFrequency
2025-06-300.5102Quarterly
2025-03-310.48Quarterly
2024-12-310.49Quarterly
2024-09-270.508Quarterly
2024-06-280.503Quarterly

Historical Market Cap

Shares Outstanding

Pembina Pipeline Corporation Executives

NameRole
Mr. J. Scott Burrows C.F.A.President, Chief Executive Officer & Director
Mr. Jaret A. Sprott PEngSenior Vice President & Chief Operating Officer
Mr. Stuart V. TaylorSenior Vice President & Corporate Development Officer
Mr. Cameron J. GoldadeSenior Vice President & Chief Financial Officer
Ms. Janet C. LoducaSenior Vice President of External Affairs and Chief Legal & Sustainability Officer
NameRoleGenderDate of BirthPay
Mr. J. Scott Burrows C.F.A.President, Chief Executive Officer & DirectorMale19802.8M
Mr. Jaret A. Sprott PEngSenior Vice President & Chief Operating OfficerMale1.22M
Mr. Stuart V. TaylorSenior Vice President & Corporate Development OfficerMale1.01M
Mr. Cameron J. GoldadeSenior Vice President & Chief Financial OfficerMale961.99K
Ms. Janet C. LoducaSenior Vice President of External Affairs and Chief Legal & Sustainability OfficerFemale1968921.91K

Discover More

Streamlined Academy

Pembina Pipeline Corporation

NYSE

Market Cap.

21.06B

Avg. Volume

1.32M

Price

1W %

1M %

3M %

6M %

1Y %

YTD %

--

--

--

--

--

--

--

Pembina Pipeline Corporation News

Pembina Pipeline Corporation Quantitative Score

Overall Score

Business

Growth

Unlock

Business

Quality

Unlock

Stock

Value

Unlock

Price

Move

Price

Momentum

Unlock

Price

Stability

Unlock

Pembina Pipeline Corporation Earnings & Revenue

Pembina Pipeline Corporation Income

Pembina Pipeline Corporation Balance Sheet

Pembina Pipeline Corporation Cash Flow

Pembina Pipeline Corporation Financials Over Time

Pembina Pipeline Corporation Executives

NameRole
Mr. J. Scott Burrows C.F.A.President, Chief Executive Officer & Director
Mr. Jaret A. Sprott PEngSenior Vice President & Chief Operating Officer
Mr. Stuart V. TaylorSenior Vice President & Corporate Development Officer
Mr. Cameron J. GoldadeSenior Vice President & Chief Financial Officer
Ms. Janet C. LoducaSenior Vice President of External Affairs and Chief Legal & Sustainability Officer
NameRoleGenderDate of BirthPay
Mr. J. Scott Burrows C.F.A.President, Chief Executive Officer & DirectorMale19802.8M
Mr. Jaret A. Sprott PEngSenior Vice President & Chief Operating OfficerMale1.22M
Mr. Stuart V. TaylorSenior Vice President & Corporate Development OfficerMale1.01M
Mr. Cameron J. GoldadeSenior Vice President & Chief Financial OfficerMale961.99K
Ms. Janet C. LoducaSenior Vice President of External Affairs and Chief Legal & Sustainability OfficerFemale1968921.91K

Pembina Pipeline Corporation Insider Trades

No data available

DateNameRoleTransactionTypeShares

No data available

Streamlined Academy

Website screenshot
EnergyOil & Gas Midstream
pembina.com

About Pembina Pipeline Corporation

Pembina Pipeline Corporation provides transportation and midstream services for the energy industry. It operates through three segments: Pipelines, Facilities, and Marketing & New Ventures. The Pipelines segment operates conventional, oil sands and heavy oil, and transmission assets with a transportation capacity of 3.1 millions of barrels of oil equivalent per day, ground storage of 11 millions of barrels, and rail terminalling capacity of approximately 105 thousands of barrels of oil equivalent per day serving markets and basins across North America. The Facilities segment offers infrastructure that provides customers with natural gas, condensate, and natural gas liquids (NGLs), including ethane, propane, butane, and condensate; and includes 354 thousands of barrels per day of NGL fractionation capacity, 21 millions of barrels of cavern storage capacity, and associated pipeline and rail terminalling facilities. The Marketing & New Ventures segment buys and sells hydrocarbon liquids and natural gas originating in the Western Canadian sedimentary basin and other basins. Pembina Pipeline Corporation was incorporated in 1954 and is headquartered in Calgary, Canada.

AI Generated Qualitative Analysis

AI

Your time is precious, so save it. Use AI to get the most important information from the business.

Learn about Pembina Pipeline Corporation

What’s This Company Really Worth? Find Out Instantly.

Warren Buffett’s go-to valuation method is Discounted Cash Flow (DCF). Our tool makes it effortless — no spreadsheets, just answers in a few clicks.

Pembina Pipeline Corporation Financials

Table Compare

Compare PBA metrics with:


Earnings & Growth

PBA

None

EPS (TTM) YoY Growth

--

--

Revenue (TTM) YoY Growth

--

--


Valuation (TTM)

PBA

None

Price/Earnings Ratio

--

--

Price/Sales Ratio

--

--


Profitability & Efficiency (TTM)

PBA

None

Net Profit Margin

--

--

Return on Equity

--

--


Financial Health (TTM)

PBA

None

Debt/Assets Ratio

--

--

Assets/Liabilities Ratio

--

--


Pembina Pipeline Corporation Dividends

Yield (TTM)Dividend (TTM) 

Infinity%

1.9882

Payment DateDividendFrequency
2025-06-300.5102Quarterly
2025-03-310.48Quarterly
2024-12-310.49Quarterly
2024-09-270.508Quarterly
2024-06-280.503Quarterly

Analysts Rating

Strong Buy

Buy

Hold

Sell

Strong Sell

Metrics Scores

MetricsScore
Discounted Cash FlowsStrong Buy
Return on EquityBuy
Return on AssetsBuy
Debt/Equity RatioStrong Sell
Price/Earnings RatioSell
Price/Book RatioSell

Price Targets


Disclaimer: This 3rd party analysis information is for reference only and does not constitute investment advice.

Historical Market Cap

Shares Outstanding

Discover More

The Secret to Analyzing Winning Stocks (Step-by-Step Examples Inside)